
after the arab spring:
the middle east continues to face a refugee crisis
The Middle East is a region that has been the backdrop to some of the globe’s most significant historical events. These events have often come at a detriment to those who call the region home.
According to data that has been collected by Our World in Data from the United Nations, since 2002, the Middle East has had approximately 9.99 million refugees by origin and 903.97 thousand asylum seekers by origin.

Syria, Afghanistan, and Iraq have the three largest contributions to this vast number of refugees. The countries change their order to Afghanistan, Iraq, and Syria with their respective number of asylum seekers.
These numbers experienced a significant increase in the early to mid 2010’s. Much of this emergency migration can be attributed to the Arab Spring, a movement that began in Tunisia. While this movement involved several Middle Eastern countries including Syria, Iraq, and Iran it expanded beyond Middle Eastern borders and included parts of Northern Africa.
In many cases, the fallout of the Arab Spring did not benefit the working class that the movement was ignited by. Instead the vacuum of power created by collapsing governments provided an opportunity for the uprising of religious extremists like ISIS, who adopted the cause for the sake of their own agendas. This was the case with ISIS’ partnering with Syrian jihadist rebels.
In 2013 former leader of Al Qaeda, Abu Bakr al-Baghdadi declared his reign over Al Qaeda and its allied forces, creating the modern day picture of ISIS. Syrian rebels and Al Qaeda separatists denied al-Baghdadi’s rule and the two groups went to war.
In 2014, while still at odds with Al Qaeda, ISIS became simultaneously pitted against Iraqi and Syrian Kurds. Shortly after, the United States involvement was sparked by the murder of American journalist James Foley. This created a multifront war between the various different groups, making these places increasingly dangerous for their civilian population.
These events are the key elements responsible for the dramatic increase in refugees and asylum seekers seen in and around 2015 in Iraq and Syria.
Bynad Sharef lived in the Kurdistinian region of Iraq with his parents for 19 years. In 2017 Sharef immigrated from Iraq to Nashville, Tennessee with a visa provided to his father for his work with the United States government. Sharef currently works for a catering company and ridesharing companies Uber and Lyft, while he teaches himself computer programming in his spare time.
Sharef says his family considered leaving Iraq on, at least, three different occasions; once in the early 1990’s because of the Kudish civil war, once in 2007 because of a deteriorating government, and finally in 2017 with the continued northern movement of ISIS. “All of that instability makes people, you know, just want to leave because basically, there's no future,” said Sharef.
Sharef says despite the concerns of safety, the act of leaving his home country has never been an easy one.
“Leaving the people you grew up with and you're so like, so familiar with the streets, the places, the language, seeing people you know, [speaking] your own language, all these experiences [are] a reality change. It can be a very deep experience, and [there are] so many emotions, different kinds of emotions, involved with that,” said Sharef.
Sharef says his family was an easy target for ISIS because of his fathers work with various international organizations like the World Food Program. Sharef says his family resettled in Nashville because of its significant Kurdish population.
“If your actual hometown is being bombarded, you have a much simpler decision to make. But if you're sort of in the vicinity of all that happening, it's more complicated,” said Sharef.
Often, the terms refugee and asylum-seeker are used interchangeably. It is important, however, to make the distinction between the two because there is a significant legal difference.
A refugee is defined as someone who has been forced to flee his or her country because of persecution, war or violence, according to the USA for the Office of the United Nations High Commissioner for Refugees.
In many cases, refugees cannot return home or are afraid to do so. In contrast, an asylum seeker is someone who claims to be a refugee but whose claim has not been evaluated. Not every asylum seeker will be recognised as a refugee, but every refugee is initially an asylum seeker, according to Habitat for Humanity Great Britain. Whereas a stateless person is someone who is not a citizen of any country.
Citizenship is the legal bond between a government and a person, which allows for certain political, economic, social and other rights of that individual. A stateless person can be a refugee or an asylum seeker.
The typical refugee starts as an asylum seeker. He or she goes to a refugee camp, usually in a different country. Once given the status of refugee he or she goes to a third country.
However, not all asylum seekers become refugees, “only the lucky ones,” says Fred Mbuga, the director of resettlement at the Refugee And Immigrant Assistance Center in Boston.
The refugee resettlement process consists of three steps: identification, access, and submission. The identification phase involves identifying whether a person needs to be resettled based on objective reasons not their subjective desire for it, according to the OCHA. The process is led by UNHCR.
Next, is the access to resettlement step, which depends on analysis and verification of their personal situation. Upon arrival to a first country of asylum, people seeking protection are registered with the host-country government, UNHCR, or both. The process involves the recording of basic information such as name, age, nationality, and family composition. Resettlement is used only for a small portion of refugees who are assessed to have compelling need of protection due to physical safety, experiences with violence or torture, and medical needs, according to the OCHA.
Officials then conduct a series of interviews and assessments to verify an individual or household for resettlement and verify their claims.
The UNHCR is then responsible for submitting most resettlement cases to destination countries. This includes a series of additional interviews and includes information about the refugee's family composition, biography, evidence of the valid refugee claim, justification of the need for resettlement, and exploration of any legal barriers or questions that may arise. Biometric information such as fingerprints and iris scans are often included, according to the OCHA.
A refugee’s case undergoes another round of review this time by the destination country. Asylum seekers that seek refuge in a first country have a difficult time migrating to a destination country because they must prove the conditions in their host country are dangerous for them.
An asylum seeker can be at a refugee camp for 25 years without a job, surviving on handouts, some without family. Those living in refugee camps for long periods of time are at risk of mental health problems. Most camps are not in the best conditions even if they are operated by the United Nations.
“The number of refugees increases every year, but less than 1% of refugees are accepted worldwide,” said Mbuga.

With Syria and Iraq maintaining the highest refugee population numbers, Jordan and Lebanon act as the primary host countries, taking in the majority of these refugees. While they are neighboring countries to Syria and Iraq, there is more to the relationship than meets the eye.
Neither host countries have ratified the 1951 United Nations Convention, creating a vague legal framework to how they interact with refugees. Because Jordan and Lebanon don’t adhere to these rules, they have more freedom to enact policies that affect refugees.
In the wake of the refugee crisis spurred by events in Syria and Iraq, the host countries have both adopted new policies aimed at curbing permanent resettlements by refugees. These policies have “affected everything from residency and mobility to access to employment, education, and healthcare, though in varying degrees depending on the country,” according to a Carnegie Middle East Center report.
In Lebanon, it has been estimated that around 1.5 million Syrian refugees are currently residing in the country, making up almost 20 percent of the country’s population. Currently, almost 90 percent of Syrian refugees live in poverty in Lebanon, and 80 percent exist without legal residency since the country stopped the UN Refugee Agency from registering new refugees in 2015, according to the Brookings Institution.
Despite these conditions in the host countries, there exists no large effort to return refugees to their countries, as it is still considered too dangerous. This has left millions of Iraqi and Syrian refugees in a state of limbo; not getting proper treatment in host countries but still not wanting to return.

As of 2020, the data from the World Bank shows that the most refugees are coming from Syria and Iraq. In 2020, 6,689,582 refugees came from Syria. As for Iraq, 333,418 refugees came from Iraq. Also, Yemen, Egypt, and Libya had a high number of refugees in 2020 compared to other Middle Eastern countries. For example, Yemen had 33,369 refugees, while Egypt had 26,604 refugees, and Libya had 17,595 refugees.
For some of these countries, the Arab Springs occurred as early as 2010. Yet, the most refugees are still coming from these countries.
One study published by Sage Journals indicates that those forcibly displaced by conflict are often subject to both mental and physical health disorders. These mental health disorders often include increased risk of depression, anxiety, and post traumatic stress disorder.
It was found in a study published by Plos One that the most common physical health issues in Middle Eastern refugees consisted of acute infectious diseases, neurological issues, and gastrointestinal complications.
Sage Journals also details that many times the indicators of these disorders are difficult to diagnose due to language barriers and cultural differences in expressing troubles. The programs set up to address mental health care often lack accessibility for those they are intended to serve or are underfunded.
In addition to pre-migration trauma, most refugees are subject to mental health disorders during the resettlement process. Some refugees, both men and women, get raped not only during situtaions of conflict in their countries but at refugee camps.
They are often in danger of prostitution, according to Willemine van de Wiel, a medical doctor from the Netherlands who has practiced medicine at refugee camps and has a certificate in global mental health. One of the refugee camps she has practiced medicine in was Moria, located in Lesvos, Greece and Europe’s largest refugee camp, which has burned down and has been replaced by another camp.
“The stories from Moria are awful,” said van de Wiel.
She came across rape victims constantly. As for fresh rapes, rapes done in camps, she encountered about six rape cases.
She believes most refugees at camps have suicidal thoughts because they get depressed from the situation. “For people to be happy you need social inclusion, a purpose in life, and you need perspective,” said Van de Wiel. Refugees do not know how long they will stay in camps or if they will ever get a visa. “Being in limbo, waiting and not knowing is very hard on people,” she said.
At most refugee camps, people are not allowed to work, according to van de Wiel. Therefore, refugees might feel like they have no purpose in life. Exceptions include Uganda where refugees are allowed to work, according to Mbuga. Instead, refugees do a lot of waiting. Waiting for food, visas, etc.
In terms of mental illness, based on van de Miel’s observations, it starts with depression, there is also anxiety, and self-mutilation. Van de Miel remembers stitching refugees’ cuts from self-harm nonstop. Some people would get delusions. On the other hand, some people were numb. Another common behavior among refugees was aggression, people would snap on one another really fast.
In Moria, many nationalities were placed in the same camp. Some groups of people were hostile towards one another. For example, some Kurdish people were targeted by people who according to van de Miel refugees would assert with confidence that they were part of ISIS.
The clinic van de Miel worked at was destroyed. It was said the clinic was destroyed by former Isis members. The refugees claimed that because someone who the former Isis members did not like was treated at the clinic they destroyed the clinic.
“People do not want refugees,” said van de Miel. That is why the conditions at refugee camps are awful.
“They don’t want it to be too pretty because they are afraid if the conditions are too good it will increase the influx of people,” she said. She believes that was the case in Greece.
Despite the effects on those displaced by war, in 2017 former United States president, Donald Trump, created an executive order banning refugees from Iraq, Syria, Iran, Somalia, Sudan, and Yemen. Each of these countries has a muslim majority and were labelled “countires of concern” in 2016 by the U.S.
This ban, often referred to as the “Muslim-ban,” threatened Sharef’s and his families ressetlment in the U.S. He says he and his family faced potential deportation because of the executive order. “We faced a very, kind of, sort of desperate situation where we were turned away and didn't have any power or anything to do about it,” said Sharef.
When he was ultimately resettled in the U.S. Sharef became involved with civil rights organizations which advocated for asylum seekers and refugee resettlement. Sharef’s father is now a case manager who aids in the resettlement of refugees.
“It's a result of people in power making decisions and everybody paying the bill, everybody else, the refugees, the people of the countries, recipient countries,” said Sharef.
Sharef says he hopes he can, one day, return to Iraq if the country were to maintain a stable political climate.
“I feel like that's something I sort of missed out on after I left, because I left at an age where I could be more independent,” said Sharef.
DATA EXPLORATION JOURNAL:
4/1/2022
I believe it would be in my group’s best interest to pursue a data driven story surrounding both asylum seekers and refugees who migrate to the United States and determine if there is a disproportionate amount of favor given to particular nations over the last two years.
We can create two comparative heat maps to see the total number of refugees fleeing each country and the total number of refugees taken in by the United States from each country. These heat maps might resemble the following:

Additionally, we can create a dashboard with data visualizations that can break up the bulk of our text.
4/6/2022
I used our hail data from class as practice with maps. I would like to combine heat maps and spider maps to display immigration patterns from the Middle East.

4/8/2022
I did not feel that my group had a pitch that was either concise enough or plausible for the time frame we currently have to put together our assignment. The data we found had too many gaps to pursue our original story idea about U.S. immigration intake. I somewhat anticipated this given the preliminary assignment we had. I intended to have to re-work our pitch slightly.
I started visualizing with the broadest data we had available from Our World in Data.
See image captions for further details on the process:

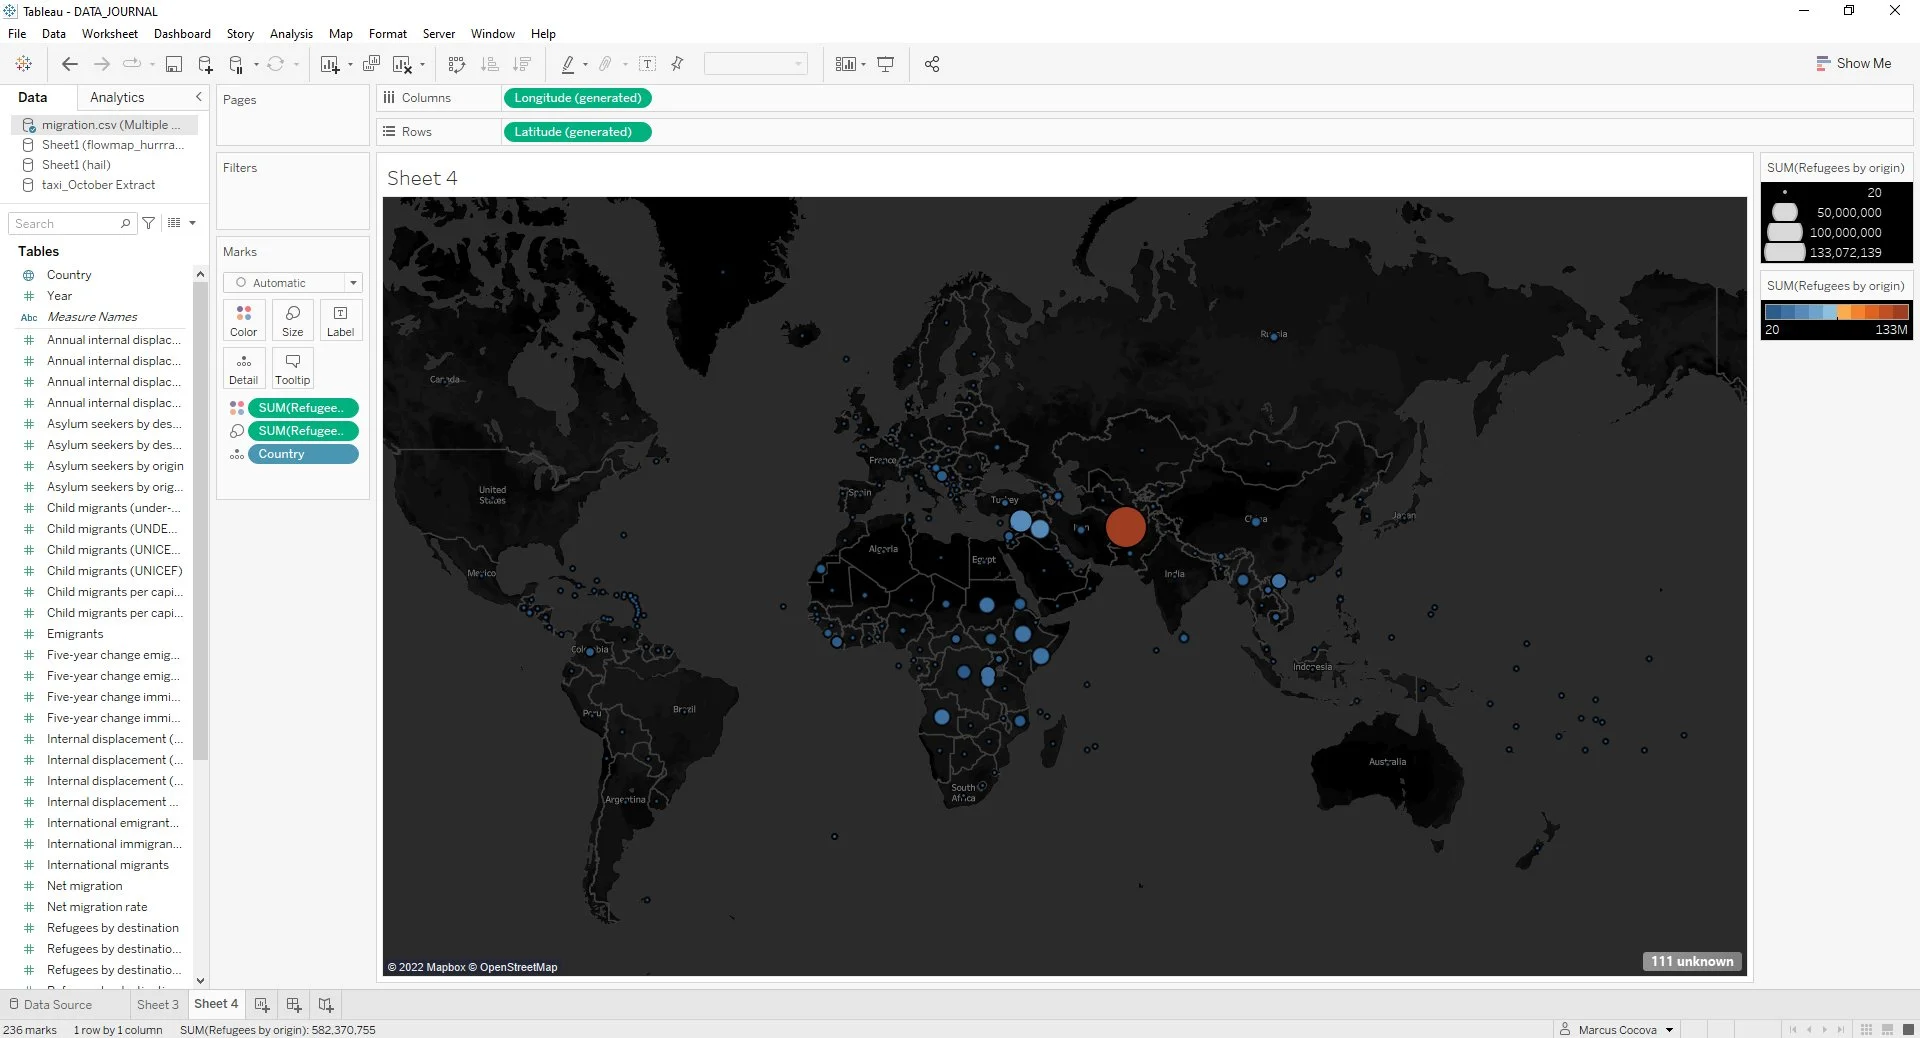


FIRST CHART:
FINAL VISUALIZATION:

PROCESS: Much of the process here was mere playing with Tableau. I spent a lot of time clicking around. When I would get a result that made sense to me and followed the track I was trying to guide my visualization along I would continue the clicking frenzy. The averaging of emergency response calls was too mundane; so I did something I was certain of: color coding. From there, I just wanted to be able to see and compare each of the years.


THREE QUESTIONS:
Why are the three different emergency response categories so similar?
Why is there such a noticeable difference in the earlier part of the year for the fire department than any other emergency response group?
What is responsible for the monthly increases and decreases across all departments of emergency response?
EXAMINING YOUR FIRST DATA SET:
The data set I selected seems to answer some of the qualms I have with information clutter on the internet. This website’s purpose seems to be to amalgamate and centralize information about gas powered emissions. Their primary goal seems to be cutting said emissions through spreading awareness. They contextualize this data by explaining how some leaks differ from others, who contributes the greats leaks, and what government action has been taken against these leaks. Their biggest deficit seems to be information on health implications of gas leaks.
Who collects this data set? If it's an organization, which department of the organization? Is there a specific person listed who you could contact?
An organization called HEET collected the data set I examined. HEET aims to lower emissions that are harmful to the planet. There are multiple “soft” departments in this organization including gas leaks, energy efficiency, and alternative energies. No specific individuals that I could find are listed online. They do, however, have a general contact email and social media platforms like LinkedIn and Twitter.
Why do you think the organization collects this data? Does it specify how it uses the data?
The organization collects their data sets for advocacy of public knowledge and governmental transparency. The data usage seems to be merely for the general interest of the public and for carbon emission cutting advocacy.
What time period does the data set cover?
The data set spans all of 2020. It includes unrepaired leaks, repaired leaks, and estimated emissions. This data set is also viewable in a variety of measures such as “equivalent annual US passenger cars.”
What are some questions you have about this data set? (Note: they can be basic like "why is this data being collected?" or very specific like "what does the field BUS_LIC_STATUS mean?")
My first question is why are there so many unrepaired leaks? What kind of governmental regulation is there for gas leaks? Though they address the cost of the gas, what is the cost of repairs for the leaks? Why are so many of these leaks centralized in a few general areas? Why is there regulation on the leaks that are of environmental concern and not public health?
Who are three types of people you could interview about this data set in order to learn more?
I would like to interview the Massachusetts EPA about the environmental implications of these leaks, residents in areas with high leak densities to discover if they are even aware of said leaks, and Eversource Energy (the company with the most unrepaired leaks in 2020).
COMPARING BY THE NUMBERS:
a cost against a cost
PREFACE:
Since the start of the pandemic, it has been reported that fewer people are moving to live in California, and more people are leaving the state. As a Californian, it seemed to be too low-hanging fruit to write a data-driven story about the similarities and differences between the typical financial standing of a household in Los Angeles, California, and Boston, Massachusetts. California is stereotypically impacted and expensive.
Rather than beat the dead horse, the focus here will be the disparity between the financial benefit of the aspiration to move to the more affordable but simultaneously much less diverse Charleston, West Virginia.
STORY:
Being from Los Angeles, California, has been many things. It has, most days, been overwhelming. With close to 4-million people, the sheer volume of individuals can make one feel suffocated.
It has, however, also provided the benefit of being immersed for most of my life among a wide gamut of cultural backgrounds. It was not until leaving the area for the first time in my life that I was able to recognize how distinct this diversity is. According to DATA-USA’s website, Los Angeles, California, is 71.3% non-white.
Only a few hours north, still in California, I found myself oftentimes uncomfortable in the predominantly white San Luis Obispo for my undergraduate study. The percentage of non-white individuals dropped by 41.9%.
Now in Boston, Massachusetts, things feel a little more like home. The city shares a much closer cultural makeup to that of Los Angeles, though it also bears a much lower population with almost 700,000 people.
The aforementioned strangle of being surrounded by such a large number of people has caused me to romanticize the idea of living in an area with a lower population density and lower homeownership costs. I have coined this my “Walden syndrome.”
Perhaps it was John Denver’s singing of an “almost heaven” which first set my sights on the scarcely populated West Virginia. Perhaps it was instead that I had heard tales of how much more affordable it is to own a home in the state. I’m not quite sure which came first. The fact remains that property values are, on average, nearly $500,000 cheaper in Charleston, West Virginia, than they are in Boston, Massachusetts. This is counterbalanced by a median income lower by nearly $36,000.
I can definitively say that the disincentive is my fact-based discovery of Charleston’s predominantly white population exceeding my former experiences in San Luis Obispo by 6.7%, still according to DATA-USA. This lack of diversity is 32.4% higher than my current living accommodations.
While homeownership is important to speculate for the future, I am satisfied with spending the remainder of my 20’s in a place like Boston with a fair blend of low population density and high diversity. This will ring true until I discover a place where I will feel more comfortable.
FIRST POST:
The data visualization that I thought was most intriguing was this one which came from Reddit’s r/dataisbeautiful.
It would have been quite simple for the author to make a bar chart to illustrate their income and expenditures. The motion of this animation is far more interesting and entertaining. I do recognize, however, that the full effect of a bar chart is somewhat lost in this adaptation. It isn’t as simple to identify the discrepancies between each of the different categories as it would be if you had a bar chart data visualization. I decided to follow FiveThirtyEight, DataIsBeautiful, and Information is Beautiful. These top three seemed to be the most accessible, well put together, and regularly updated. I am assuming that’s why they were listed first.
